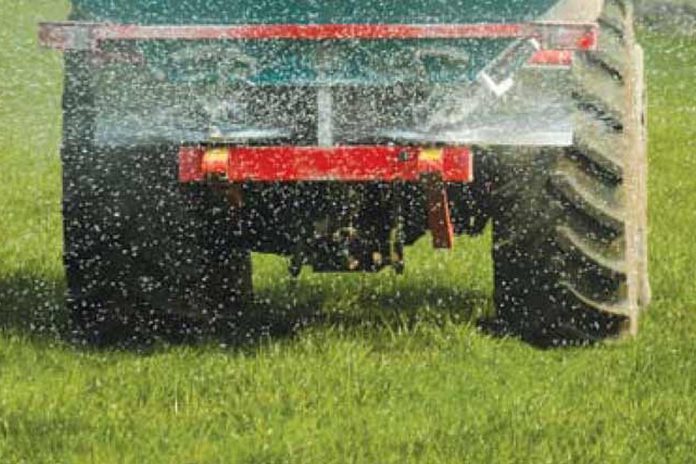
Fertiliser sales were “at their highest” in 2000 at just over 1.7 million tonnes, new data from the CSO shows.
The new release from the CSO – which the body published this morning (Tuesday, July 19th, 2022) – contains data on fertiliser sales from 2000-2021.
The body reports that fertiliser sales were at their lowest from 2007-2012 but reached over 1.7 million tonnes again in 2018. They stood at just shy of 1.7 million tonnes last year.
It compiles data on total fertiliser sales for the crop year and publishes under the calendar year.
For example, nutrient and fertiliser data for 2021 refers to the crop year from the beginning of October 2020 until the end of September 2021.
In that crop year, 4% of fertiliser sales took place between October and December 2020, and 52% of sales took place between January and March 2021.
A further 30% were from April to June 2021, and 15% of fertiliser sales occurred between July and September 2021.
Fertiliser Sale date:
| Tonnes of Fertiliser | % | |
| Year1 | Total Fertiliser Sales | Crop Year Change |
| 2000 | 1,730,437 | |
| 2001 | 1,545,910 | -11% |
| 2002 | 1,523,484 | -2% |
| 2003 | 1,628,384 | 7% |
| 2004 | 1,537,961 | -6% |
| 2005 | 1,479,298 | -4% |
| 2006 | 1,426,960 | -4% |
| 2007 | 1,330,183 | -7% |
| 2008 | 1,242,073 | -7% |
| 2009 | 1,172,424 | -6% |
| 2010 | 1,330,406 | 14% |
| 2011 | 1,203,509 | -10% |
| 2012 | 1,231,285 | 2% |
| 2013 | 1,486,977 | 21% |
| 2014 | 1,402,878 | -6% |
| 2015 | 1,395,399 | -1% |
| 2016 | 1,411,913 | 1% |
| 2017 | 1,552,809 | 10% |
| 2018 | 1,714,729 | 10% |
| 2019 | 1,547,082 | -10% |
| 2020 | 1,592,218 | 3% |
| 2021 | 1,685,412 | 6% |
[Source: CSO]
| Fertiliser Sales by Quarter, 2015-2021 – Source: CSO | |||||
| % | Tonnes | ||||
| Year1 | Q1 (Oct-Dec) | Q2 (Jan-Mar) | Q3 (Apr-Jun) | Q4 (Jul-Sep) | Total |
| 2015 | 2% | 46% | 39% | 14% | 1,395,399 |
| 2016 | 2% | 38% | 45% | 15% | 1,411,913 |
| 2017 | 4% | 45% | 35% | 17% | 1,552,809 |
| 2018 | 3% | 34% | 41% | 22% | 1,714,729 |
| 2019 | 4% | 42% | 41% | 14% | 1,547,082 |
| 2020 | 2% | 45% | 38% | 15% | 1,592,218 |
| 2021 | 4% | 52% | 30% | 15% | 1,685,412 |
Other farming news articles on That’s Farming:


